PowerDNS:PowerDNS Reporting: Difference between revisions
No edit summary |
No edit summary |
||
| (3 intermediate revisions by one other user not shown) | |||
| Line 27: | Line 27: | ||
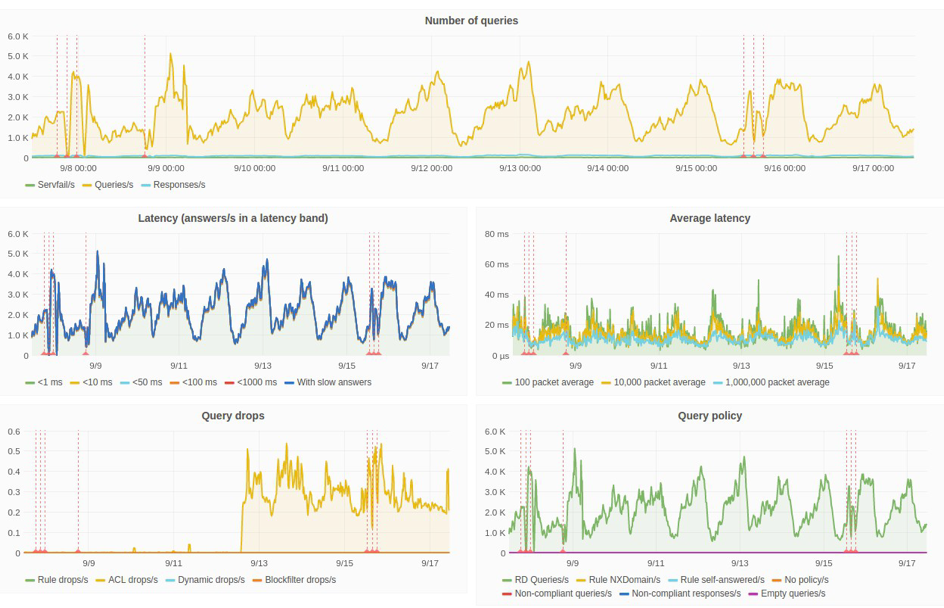
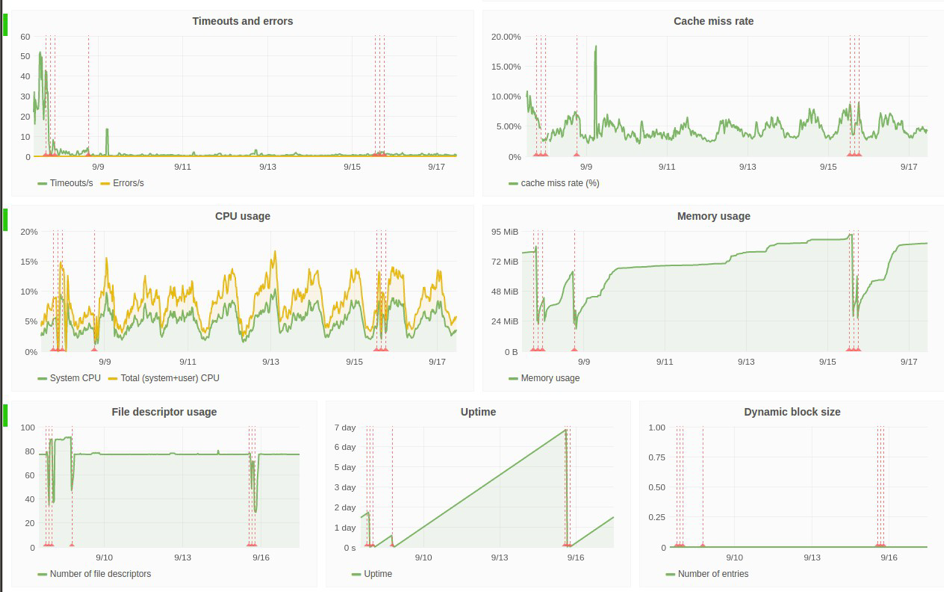
Some dashboard examples are shown below. These live reporting dashboards are based on industry standard graphing protocols (Carbon / Graphana, Graphite-API) and can also be integrated into existing network / operations monitoring solutions. | Some dashboard examples are shown below. These live reporting dashboards are based on industry standard graphing protocols (Carbon / Graphana, Graphite-API) and can also be integrated into existing network / operations monitoring solutions. | ||
[[Image:Reporting_1.png]] | |||
[[Image:Reporting_2.png]] | |||
=== Live display === | |||
The live display shows the query rate and pattern every second to keep Customer technicians up to speed on current DNS performance. This second-by-second tracking quickly shows issues with domain names or clients to support rapid resolution. This live display is built for technical personnel, rather than presenting a management overview. | |||
The live security panel, which shows the number of attacks currently in progress, and which IP addresses and domain names are being shielded, is shown below: | |||
=== Scheduled reporting === | |||
Real-time graphical overviews serve their purpose for up-to-the-minute monitoring. However, they do not highlight critical issues which require comparison of data over time. | |||
To meet this need, PowerDNS also produces automated reports which highlight: | |||
* Total volume metrics, compared to previous reporting period | |||
** Average QPS, Peak QPS (30 seconds), Peak QPS (1 hour), filtered queries (ACL security, dynamic abuse/malware blocking, tunnel/revenue leakage blocking) | |||
* Total quality metrics (answer speed, drop rate), compared to previous reporting period | |||
** Latencies, customer experience metric | |||
* Per server instance availability | |||
** Self-reported | |||
** Externally measured | |||
* Fast response availability, slow response availability | |||
* Per server quality & volume metrics | |||
** Per server PowerDNS resource utilization | |||
** CPU utilization | |||
** Per-server low CPU idle time, indicating non-PowerDNS activities on server | |||
** Peak memory use | |||
** Operating-system reported packet drops | |||
Some examples of these reports are shown below. These reports are the standard preconfigured reports, available out-of-the-box through the PowerDNS Platform web interface. (For a more detailed example, please see the PowerDNS Sample Weekly Report attached. | |||
Scheduled reports, with distribution lists, and end-user configurable reports are based on our support for the industry standard JasperReports software. This implements PDF creation, email distribution, and custom reporting, all based on our reporting XML. | |||
=== Full per-query, per user results.=== | |||
The PowerDNS Platform can also show detailed user data for advanced troubleshooting. | |||
[[Image:Reporting_5.png]] | |||
[[Image:Reporting_6.png]] | |||
[[Image:Reporting_7.png]] | |||
Latest revision as of 09:31, 7 November 2022
PowerDNS Reporting
Reporting
The PowerDNS platform knows various types of reporting. It provides both reporting about the functioning of the DNS platform itself (both through real-time dashboards and live displays, as well as through periodically generated reports on average performance for a management overview) and about the malware protection and other dynamic platform capabilities like the parental control functionality.
Reporting: Generic DNS
PowerDNS Platform reports on its operation in a variety of ways:
- Attractive and actionable dashboards, with global and regional status updates and statistics
- Live display of currently queried domain names and active IP addresses
- (Scheduled) reporting giving summaries of operational performance over configured time periods
- XML files of raw data underlying reports
- Full insight into exact traffic DNS, including who looked up what, speed and status of each query (optional)
Attractive dashboards
PowerDNS dashboards plot statistics about both historical and 'here and now' operations. They are good for rapidly updated, wall mounted, status panels for global operations monitoring. These graphs can also assist technicians in determining the cause of degraded services, and help to troubleshoot local networking problems, connectivity issues, or issues with the name server functions.
The dashboards have the following features:
- Grouped by region
- Actionable metrics
- Color-coded status of regions and individual servers
- Attack patterns
- Mitigation measures
- Can be changed and configured by Customer staff
Some dashboard examples are shown below. These live reporting dashboards are based on industry standard graphing protocols (Carbon / Graphana, Graphite-API) and can also be integrated into existing network / operations monitoring solutions.
Live display
The live display shows the query rate and pattern every second to keep Customer technicians up to speed on current DNS performance. This second-by-second tracking quickly shows issues with domain names or clients to support rapid resolution. This live display is built for technical personnel, rather than presenting a management overview.
The live security panel, which shows the number of attacks currently in progress, and which IP addresses and domain names are being shielded, is shown below:
Scheduled reporting
Real-time graphical overviews serve their purpose for up-to-the-minute monitoring. However, they do not highlight critical issues which require comparison of data over time.
To meet this need, PowerDNS also produces automated reports which highlight:
- Total volume metrics, compared to previous reporting period
- Average QPS, Peak QPS (30 seconds), Peak QPS (1 hour), filtered queries (ACL security, dynamic abuse/malware blocking, tunnel/revenue leakage blocking)
- Total quality metrics (answer speed, drop rate), compared to previous reporting period
- Latencies, customer experience metric
- Per server instance availability
- Self-reported
- Externally measured
- Fast response availability, slow response availability
- Per server quality & volume metrics
- Per server PowerDNS resource utilization
- CPU utilization
- Per-server low CPU idle time, indicating non-PowerDNS activities on server
- Peak memory use
- Operating-system reported packet drops
Some examples of these reports are shown below. These reports are the standard preconfigured reports, available out-of-the-box through the PowerDNS Platform web interface. (For a more detailed example, please see the PowerDNS Sample Weekly Report attached.
Scheduled reports, with distribution lists, and end-user configurable reports are based on our support for the industry standard JasperReports software. This implements PDF creation, email distribution, and custom reporting, all based on our reporting XML.
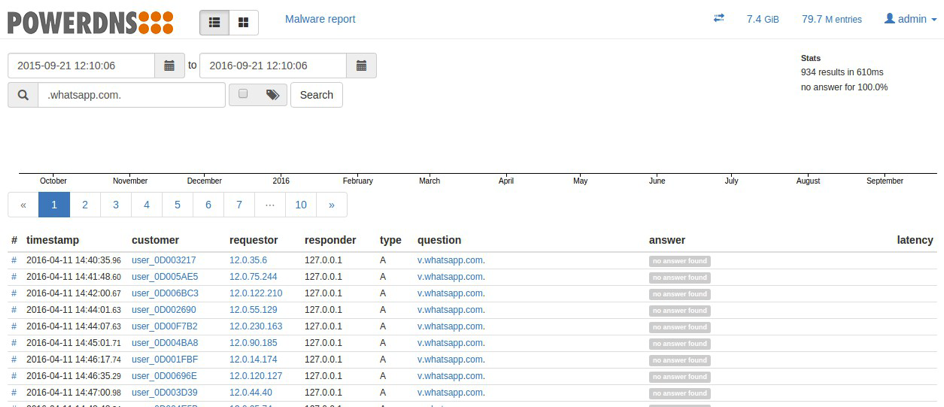
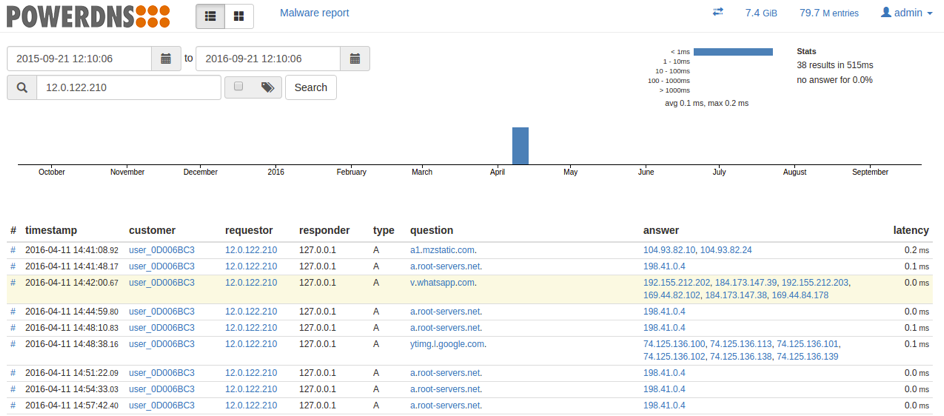
Full per-query, per user results.
The PowerDNS Platform can also show detailed user data for advanced troubleshooting.


